Here’s a pandemic project that I think turned out pretty well:

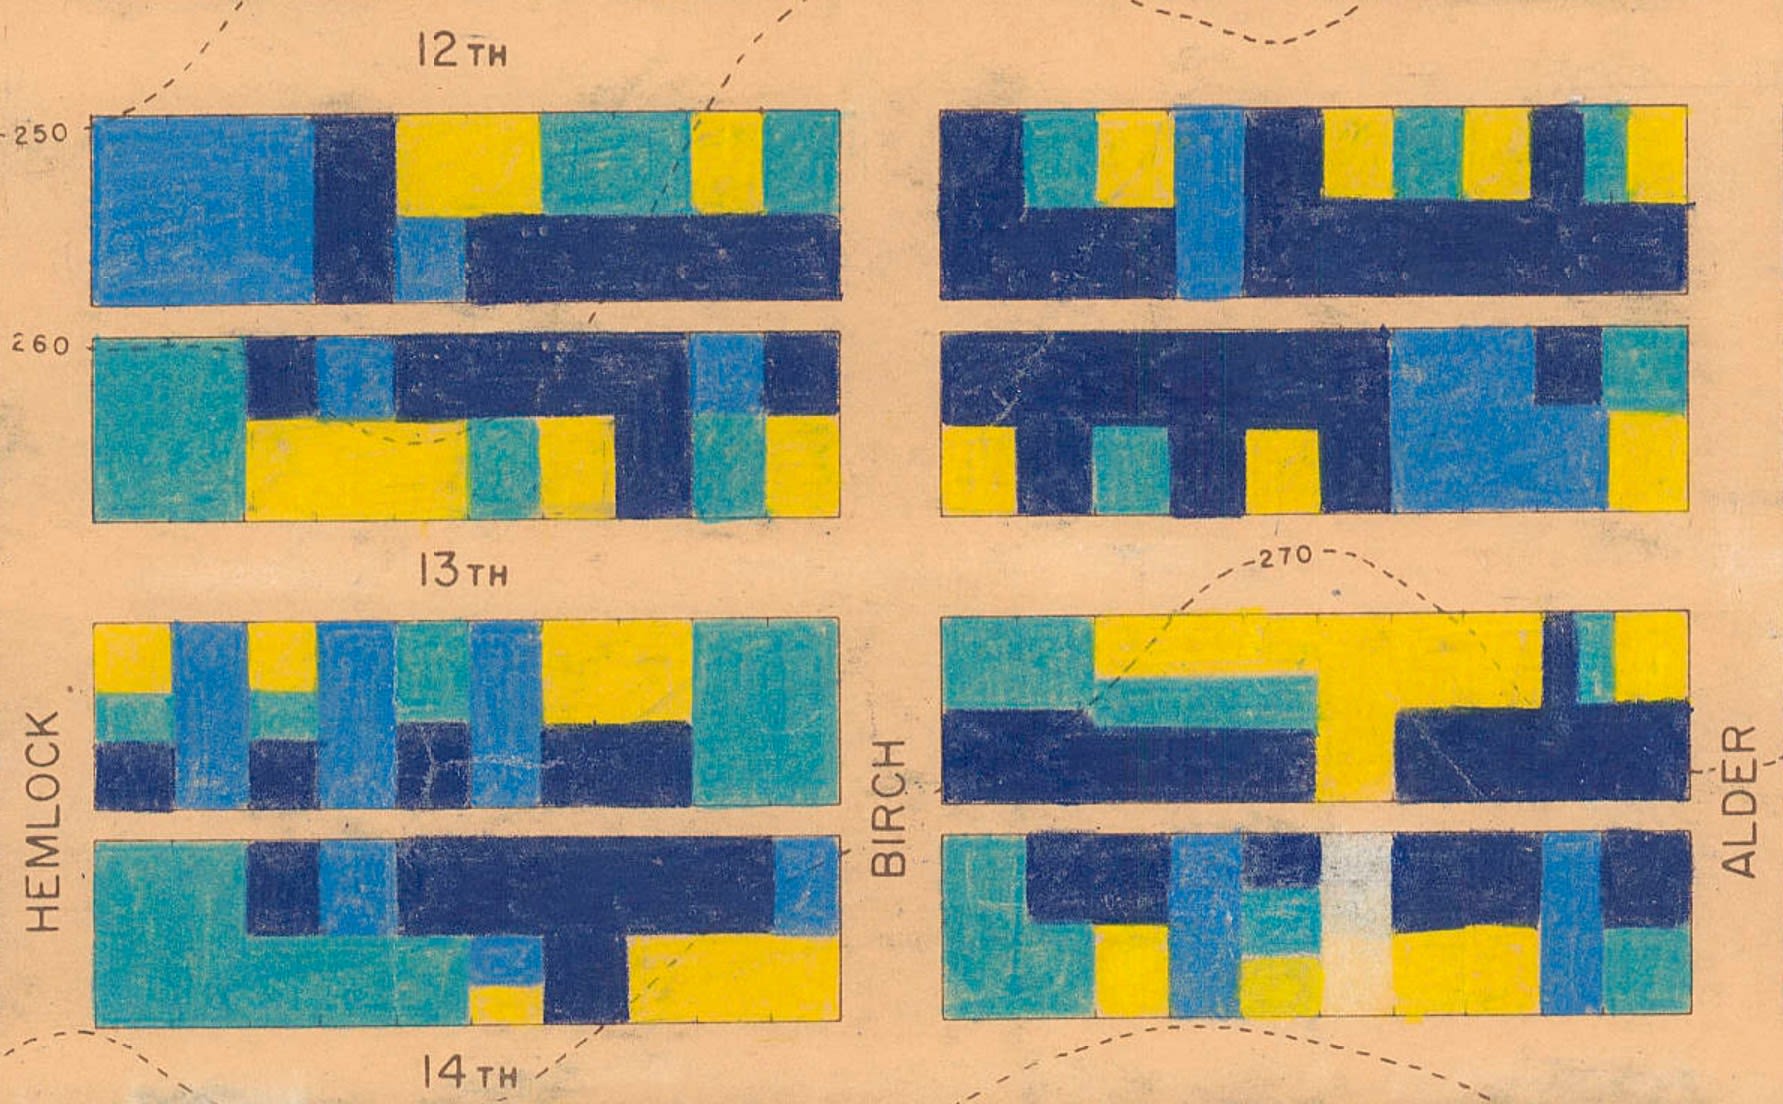
In 1954, Vancouver’s planning department put together a remarkable hand-coloured map showing the age of every building in the city. Thankfully for us, the Vancouver Archives made scans of the map available in impressively high resolution:

I took the scans for the northern (and most interesting) half of the city, had them cleaned up and colour-corrected, then printed them on wooden blocks. The whole thing is about 2 metres wide, and let me tell you it was a pain to hang.
I’m quite happy with how the project turned out, but if I were to redo it I’d whiten the yellowed background; I think that would make the colours really pop.
OK but what’s the point?
My sole motivation when starting this project was “dang, that’s a neat-looking map!” However, looking at it daily really drives home how little Vancouver’s built form has changed since 1954. Most of Vancouver was single-family houses then; most of Vancouver is single-family houses now.
If you’d like a copy of the cleaned up scans, just give me a shout.


