Land Use Visualization using Angular and the Canvas element
Software for Housing, Part 2
I recently built a web tool to solve a simple question that comes up often in urban planning: after taking setback requirements into account, how much of lot can be built on? The answer is often surprising: for example, Vancouver’s most common residential zone only allows houses to cover about 28% of the land.
It was a fun weekend project, and a few weeks later I decided to upgrade it on a long plane ride. It’s now a neighbourhood-level simulator with many more parameters:
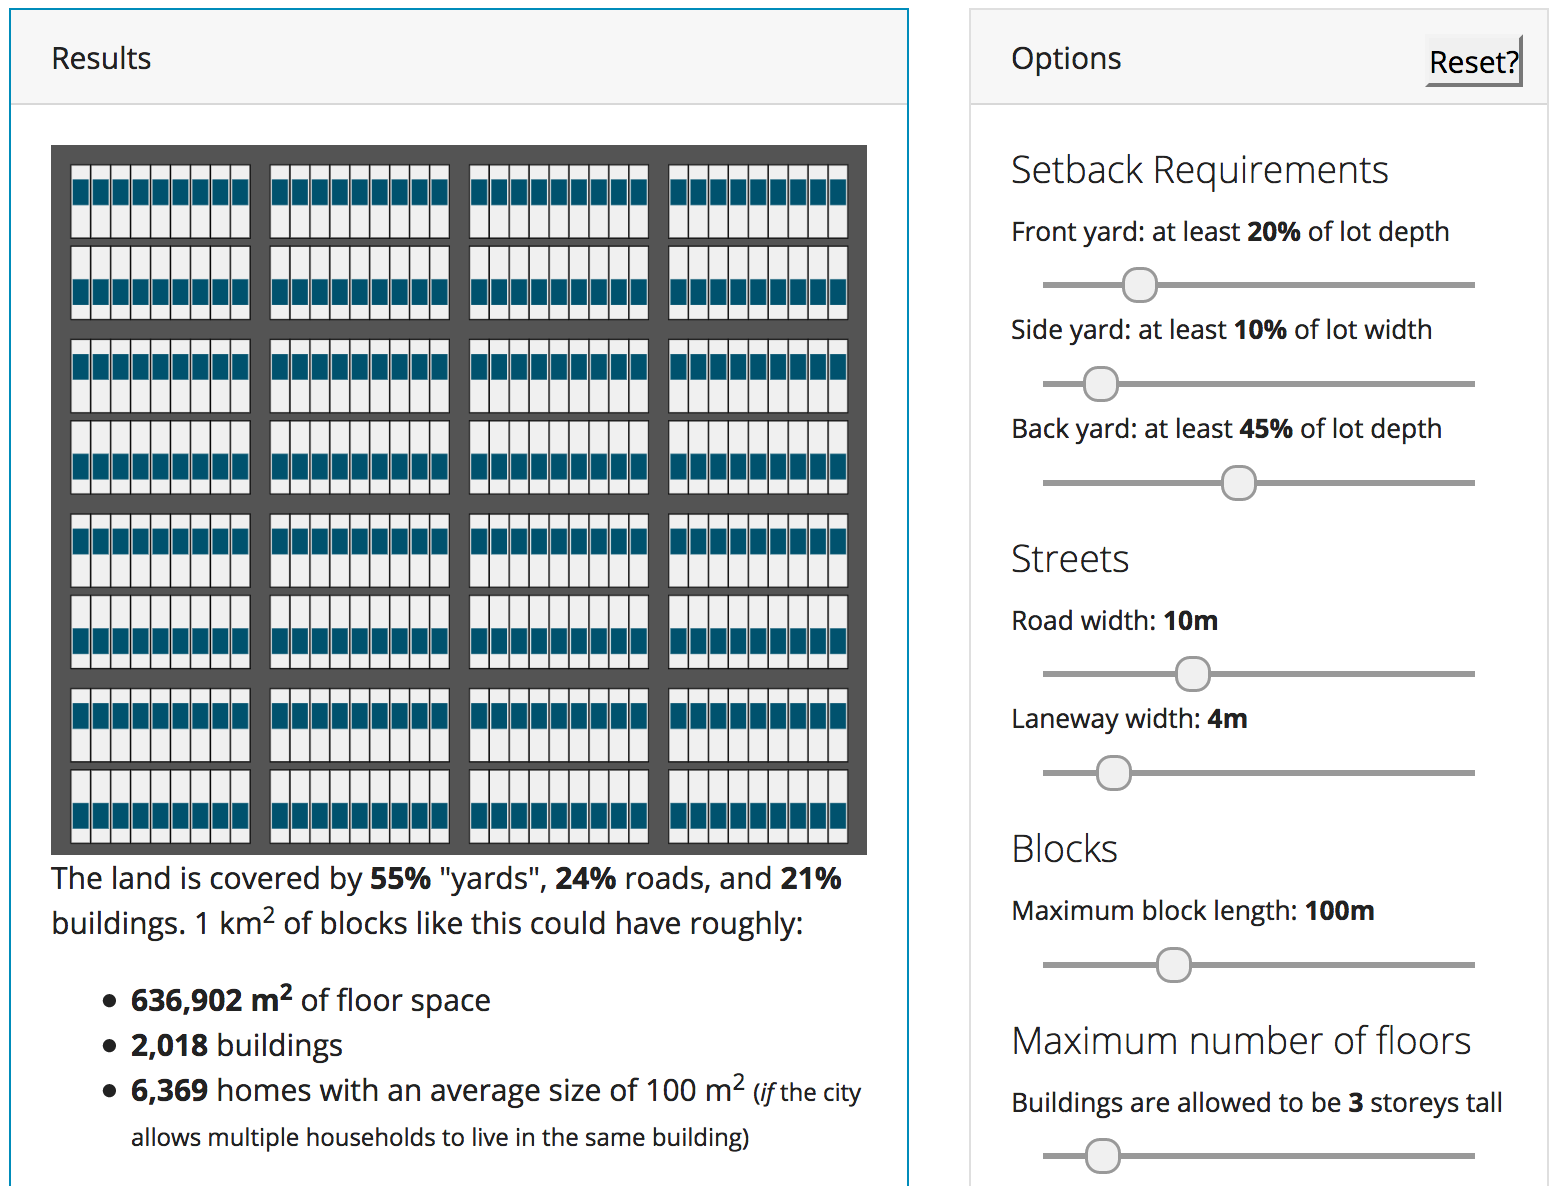
These are mobile and desktop-friendly, and the visualization is entirely done in the browser. Here’s how it all works.
Technologies Used
The visualization is drawn natively in the browser using the HTML5 Canvas element. This was my first time using Canvas and it (unsurprisingly) feels very similar to 3D graphics programming; simple operations are generally done by moving the drawing context instead of the objects you’re drawing. Once you wrap your head around that it’s not bad at all, especially with judicious use of the save() and restore() methods on CanvasRenderingContext2D to push and pop rendering contexts for later use.
As I often do, I used Angular CLI to create an Angular project. It makes setting up an Angular project dead simple:
ng new neighbourhood-visualizer
Angular isn’t really needed for a small single-page project like this, and I admit that I wince every time I see the size of its compiled output. Still, it’s a really nice development experience. You get a lot for free (TypeScript integration, build+test tooling, templating, reactive forms…) just by creating an Angular project.
In this case, I wanted to use Reactive Forms to bind controls to the underlying data model. Specifically, I was worried about the <canvas> visualization being too expensive, and I wanted an easy way to throttle the rendering if needed (say someone moves the sliders very quickly and the rendering can’t keep up).
The reactive programming model makes this super easy because the data changes are exposed as observables and we can trivially transform the stream of changes from the observable. For example, this code calls render() every time the form values change:
this.inputForm.valueChanges.subscribe(val => {
      render();
    }
If we want to throttle it so render() is called only every 200 milliseconds at most, we just add a call to debounceTime():
this.inputForm.valueChanges.debounceTime(200).subscribe(val => {
      render();
    }
As it turns out, <canvas> performance is more than fast enough and I don’t need to throttle rendering at all. Premature optimization something something. :)
What’s Next?
Extrapolating from recent progress, I should have a decent SimCity clone in a few years’ time. In the meantime, I have a few smaller goals on my plate:
- I’d like to add some presets – it would be nice if people could easily compare different neighbourhoods in popular cities.
- I’d like to add more esoteric options like laneway houses
- This might require a rethink of the UI – perhaps separate ‘beginner’ and ’expert’ modes.
The source code for the visualizer is available on GitHub, so if you’d like to customize it for your own needs please do! I’m also keen to see this used for real world pedagogy. If you’d like to use this for teaching just give me a shout and I’d be happy to discuss potential customization.


